
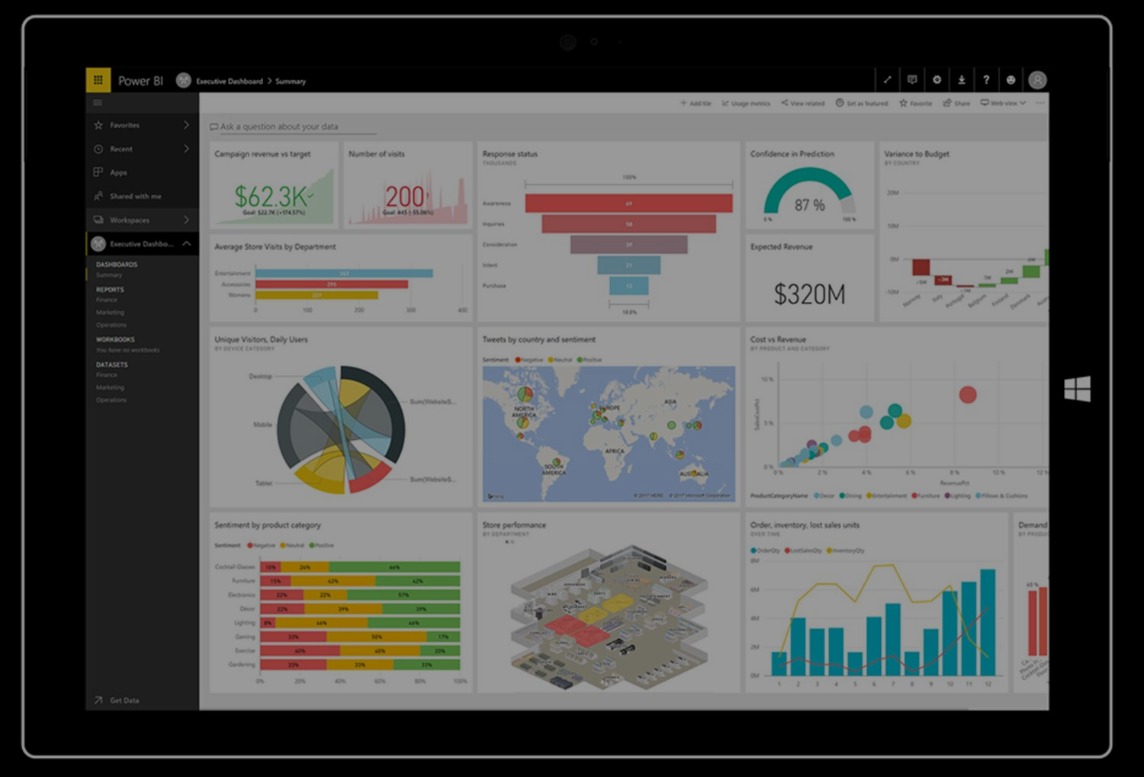
Power BI - Excel Reports and Dashboards
MicroangeloIT can provide you with a reporting and or business analytics solution that lets you visualize your Excel Data in an easy to use dashboard. MicroangeloIT can connect to hundreds of data sources and bring your data to life with live dashboards and reports. The dashboard helps propel your organization into a modern technology culture. With powerful self-service abilities, no longer are business users dependent on IT for gather transforming and analyzing data.
When you hear the word “Excel” chances are you think of “spreadsheet” instead of “superior reporting tool.” But depending on your organisation’s size and strategic reporting needs, Excel may not be the best fit and or software built specifically for reporting and therefore MicroangeloIT has a better option.
Using Microsoft Power BI, MicroangeloIT can produce dashboards that are easy to use and visually powerful and appealing compared to Microsoft Excel. Power BI is mostly used for data visualisations and dashboard where as Microsoft Excel is mostly used for in depth analysis. Microsoft Power BI is a more powerful reporting tool compared to Microsoft Excel.
Let our examples below speak for themselves. Login is Guest with no password
The following is a portfolio of sample companies with sample data. You are welcome to view the report online. The Login is Guest with no password. The reports are mobile friendly.
"MicroangeloIT - Creating Effective Reports and Dashboards"
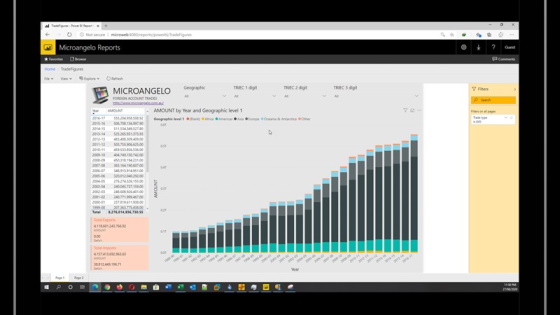
Australian Trade Figures
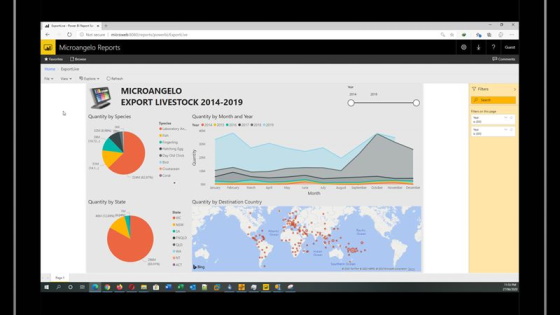
Australian Export Livestock
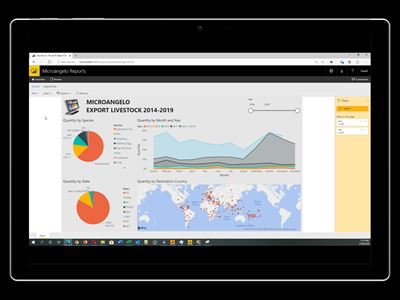
This report is a sample of a single page report with drill down. The report shows the export live trade for each country from Australia.
Retail Analysis
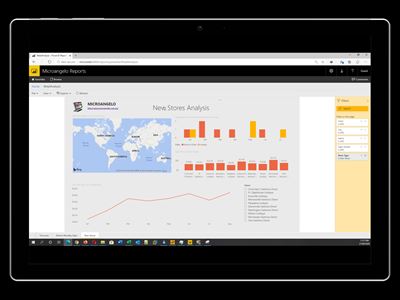
This report is a sample of a single page report with drill down. The report shows the revenue from each store and location of sales.
AdventureWorks Example
This report is a sample of multiple pages with drill down. The report shows orders by category and location including details of revenue and trends.
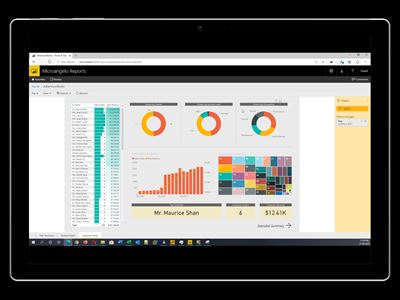
Maven Market Report
This report is another sample of a single drill down report with revenue broken down by product date and location.
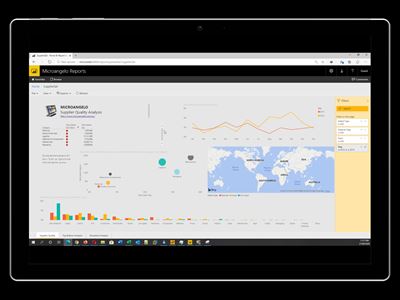
Supplier Quality Assurance
This report is a sample of a triple page report with drill down. The report shows the supplier quality from each department.
MicroangeloIT Reporting
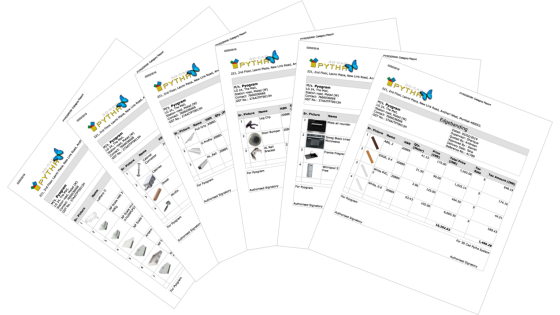
Excel Custom Reporting - PYTHA
The following are examples of the reports generated using the Pytha Report Generator. This was a customised reporting solution written to generate reports out of Pytha 3D. We can import from any system and can generate reports to your customized needs.
MicroangeloIT (Power BI)
Excel Report - Maven Market
The following is a video demonstration of the Maven Market Power BI Example (Excel Reporting). The interactive interface gives the user a sense of control compared to a printed report.
MicroangeloIT (Power BI)
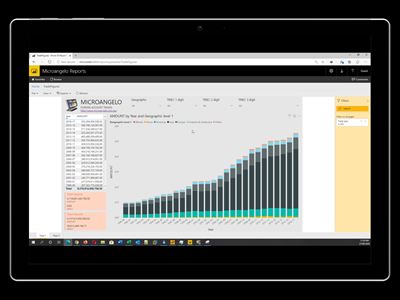
Australian Trade Figures
The following is a printable version of the Australian Trade Figures Power BI Example (Excel Reporting). The interactive interface gives the user a sense of control compared to a printed report.
MicroangeloIT (Power BI)
Australian Export Livestock
The following is a printable version of the Export Livestock Power BI Example (Excel Reporting). The interactive interface gives the user a sense of control compared to a printed report.
Power BI for everyone
Three simple ways to get started today.
$199
Single Page Dashboard
For a limited time only MicroangeloIT is offering a single page dashboard with up to 5 interactive graphs.
One months hosting included
$399
Multi Page Dashboard
For a limited time only MicroangeloIT is offering a single page dashboard with up to 5 interactive graphs.
One months hosting included
$???
Realtime Dashboard
MicroangeloIT can source your data in real time from any ERP system making the dashboard up to date at any point in time.
Hosting and data uploads are included.
For any questions regarding our pricing plans above, don't hesitate to contact us!
Let MicroangeloIT provide you with a businesss analytics solution that lets you visualize your data in an easy to use dashboard. We can connect to hundreds of data sources and bring your data to life with live dashboards and reports. The dashboard helps propel your organisation into a modern technology culture. With powerful self-service abilities, no longer are business users dependent on IT for gather transforming and analysing data.
Using Microsoft Power BI, MicroangeloIT can produce dashboards that are easy to use and visually powerful and appealing compared to Microsoft Excel. Power BI is mostly used for data visualisations and dashboard where as Microsoft Excel is mostly used for in depth analysis. Power BI is a more powerful reporting tool compared to Microsoft Excel.